Before attempting to answer the title question, we should be clear about what the term ‘periodicity’ actually means—and where better to turn for an explanation than the matchless OED. The entry under ‘chemistry’ is the most relevant, viz. ...
Before attempting to answer the title question, we should be clear about what the term ‘periodicity’ actually means—and where better to turn for an explanation than the matchless OED. The entry under ‘chemistry’ is the most relevant, viz. ‘The complex periodic variation of the properties of the chemical elements with increasing atomic number’, the term’s use in this context dating from the nineteenth century. This was, of course, the time of the so-called chemical revolution and is, therefore, a good place to begin.
In fact, the chemical revolution started a little before the nineteenth century with the work of Antoine Lavoisier. Of his many contributions during the 1780s, one of the most important was to define a chemical element as a substance which cannot be further decomposed by chemical means. Soon after came John Dalton’s atomic theory (in the early 1800s) in which he proposed not only that all matter is made of atoms but that atoms have weight and, furthermore, that atoms of different elements (he accepted Lavoisier’s definition) have different weights. Accurate atomic weights (strictly, relative atomic weights) were not that easy to determine but following the Karlsruhe Congress organised by Stanislao Cannizzaro in 1860, a list of atomic weights for most of the sixty-odd elements then known became widely accepted. Such a list was important for many reasons but not least for the subsequent development of the periodic table which orders the elements according to their atomic weight (later by atomic number) but also in a manner that reflects their observed chemical similarities.
With regard to these similarities, it was Johann Döbereiner who, in the 1820s, drew attention to certain resemblances within particular groups of three elements (Döbereiner’s triads)—lithium, sodium, potassium and chlorine, bromine, iodine, for example. Additional groupings, some with more than three members, were later highlighted by others but by the 1860s several chemists had also begun to notice underlying regularities. Among them was John Newlands, who recognised that for the first fifteen elements known at that time (hydrogen to chlorine; helium and neon had not yet been discovered), chemical similarities were observed to repeat every eight elements, which he codified as the Law of Octaves. In just a few years, tables depicting further regularities were constructed with many more elements, most notably by the Russian chemist Dmitri Mendeleev, who published his first periodic table in 1869. (For an excellent history of the periodic table, see: The Periodic Table: Its Story and its Significance, 2nd edition, E. Scerri, Oxford University Press, 2020.)
It should not be forgotten that in these early periodic tables, the regular arrangement of elements according to their chemical similarities was entirely based upon empirical observations. But why should there be any such similarities and, moreover, why should these similarities occur in a regular or periodic manner? Something at a fundamental level must repeat, albeit imperfectly, but in the nineteenth century, it was entirely unclear what the nature or origin of this repeat might be.
By the end of the nineteenth century most chemists accepted that matter was indeed made of atoms, but it would soon be determined that atoms were not indivisible: they had structure. A model of the atom in which most of its mass, along with its positive charge, was concentrated in a tiny nucleus around which were distributed the much lighter, negatively charged electrons (discovered by J. J. Thomson in 1897) was proposed by Ernest Rutherford in 1911. Not long after, it was established that elements were better ordered according to the number of units of positive charge in the nucleus (later identified with the number of protons present), the so-called atomic number, rather than according to atomic weight (the number of protons plus neutrons).
At around this time, it was also revealed, principally by the Danish physicist Niels Bohr, that electrons in atoms occupied discrete shells, the reasons for which would emerge from the nascent quantum theory. As this theory developed it was established that these shells could accommodate up to a certain number of electrons but no more, initially two with a maximum of eight allowed in the next shell. Accordingly, we can represent the electronic structure of, for example, lithium (which has three electrons) as Li (2,1) whereas sodium (which has eleven electrons) would be denoted as Na (2,8,1). Thus, each has one outermost electron which accounts for why their chemistry is similar, albeit not identical; the chemistry of an element is determined in large part by the number of outer electrons.
Of course, it’s a bit more complicated than this (actually quite a lot more complicated) but at a fundamental level quantum theory allows us to understand the origins of chemical periodicity according to the electronic structure of atoms—ultimately providing the answer to the title question: why does the chemistry of some elements resemble the chemistry of others?
Featured image by PAVM. Public domain via Pixabay.
Climate change has become an everyday reality. Communities, businesses, and nations are being battered by impacts that would have seemed impossibly apocalyptic a decade ago: unprecedented heat waves, destructive storms, crop failures, floods, and wildfires. Global action to reduce greenhouse gas emissions is too slow, and we are likely to breach 2 degrees Celsius above pre-industrial levels as soon as 2050. As the global temperature increases, so does the likelihood of exceeding tipping points, bringing further environmental destabilisation with serious consequences for all forms of life.
The causes and physical consequences of this predicament have been exhaustively established by scientists and modellers. The possibilities for decarbonisation, and its challenges, are also well covered in the academic literature. Far less examined are the implications of plausible climate change trajectories for human societies and cultures.
In Climate Adaptation, forthcoming in Oxford Intersections, we seek to offer a thought-provoking body of work from across disciplines, including from the humanities, social sciences, arts, and from Indigenous scholarship. Our central question is “Who will we become?” In seeking answers, Climate Adaptation highlights opportunities to rethink our relationships with one another, with knowledge, and with the world. We seek to stimulate new ways of thinking and taking action for greater resilience to climate instability. Here are a few of the approaches our contributors are taking.
Learning from the past
In a world in which unprecedented levels of production and consumption have become normalised, it is difficult (but necessary) to consider how current economic and social systems could be destabilised by climate change, and how humans might respond. We can learn much from the past. Our contributors explore topics such as:
How have Indigenous cultures survived and sustained themselves despite massive environmental, political, and social change?
What lessons can be drawn from history and prehistory, of the experiences of societies that faced climatic and environmental shocks, especially those that adjusted and thrived?
Rethinking governance, justice, and responsibility
Many existing institutions, laws, and governance arrangements are unprepared for the rate and scale of climate change and are scrambling to adjust. We explore how adaptation at all scales—from local to global—can be restorative and equitable, especially with regards to future generations and those that are already structurally disadvantaged. What transformations are necessary in dominant institutions, organisations, and systems of governance?
Our contributors necessarily think boldly, as addressing these questions will require not simply modifying existing systems, but, in many cases, transforming them to become fit for a changing world.
The importance of place
While the effects are global, climate change is by its very nature a localised experience. Each place, and the people of that place, are impacted in distinctive ways. In many climate-impacted locations, communities and organisations are already taking action designed for their needs and circumstances, often collaborating across governance scales. Our contributors explore topics such as:
What can be learnt from innovative approaches (often at local and regional scales) for addressing the immediate impacts and long-term challenges?
How can place-based communities work collaboratively with central and local governments to lead or help shape their own climate responses?
Between optimism and catastrophe
Public discussions about climate futures are generally framed between two extremes. In the optimistic view, it is possible to achieve a sufficiently radical transformation of global politics, businesses, infrastructures, technologies, and behaviours to halve global GHG emissions in the handful of years before 2030, and for these to continue to drop rapidly to net zero over the following 20 years. In the pessimistic view, this is unachievable and we are thus facing a dystopian world dominated by conflict, mass migrations, hunger, disease, and despair. The former now appears to be unlikely; the latter, unimaginably terrifying. Neither perspective provides a way to explore the space in between extremes.
Our experiences of climate change are already starting to reveal its social, economic, and cultural implications. Our contributors explore its likely ramifications, along with ways to envision and create positive narratives of alternate futures. Is our ability to transform and adapt hampered by our capacity to imagine different ways of being?
Climate Adaptation, forthcoming in Oxford Intersections, explores the fundamental question of we will become—individually and collectively, locally and globally—when old certainties melt away, and new realities have become the everyday experience.
Leading the commissioning of articles on these questions is our brilliant team of section editors which encompasses scholars from the global south and global north, Indigenous scholars, early-career and seasoned scholars, and multiple disciplines and knowledge systems.
Climate Adaptation will be launched in Fall 2026. If you’re interested in getting involved, let us know.
Everyone knows that many salamanders can regenerate legs and tails while mammals never can (Figs.1, 2). If you tell a layperson that you work on regeneration, they will inevitably ask, “How can they do it when we can’t?” For most of my career, I was obliged to answer, “We don’t know”, and reflect on the fact that the key questions of science really are those simple ones asked by lay people.
The great news of the last few years is that now we do know. At least, now we have some good ideas about how it works, although there are still many gaps to fill. The two key concepts are cell potency and positional information. Cell potency relates to the range of cell types that the cells of a regenerating structure are able to become. Positional information relates to a system of signals that vary with position within the regenerating structure and control what pathway of differentiation those cells adopt.
Fig. 1. The axolotl, a favourite animal for regeneration research. Image credit: Jonathan Slack
Fig. 2. A limb regenerating from an upper arm amputation over 146 days. From Wells, K.M., et al., 2021. eLife 10, e68584.
Let’s start with the cells and consider those cells making up the limb of a vertebrate animal. The skeletal structures and connective tissues of limbs arise in embryonic development from a limb bud—a structure consisting of a loose mass of cells wrapped up in an outer layer. The loose cells are multipotent, meaning that they can become any one of a series of connective tissue cell types: bone, cartilage, tendon, ligament, or dermis (the inner layer of the skin). The other principal structures of a limb: the muscles, nerves and blood vessels, are formed from separate cell populations that grow into the bud during limb development.
When an adult salamander limb is amputated, the connective tissue cells near the cut surface dedifferentiate and become a uniform population of multipotent cells very similar to those of the embryonic limb bud. This fact has only been discovered recently, and it relied on a very powerful modern technology: single-cell RNA sequencing, which enables individual cells to be analysed to find which genes are active and to what extent. This is not the case for the cells of frog tadpole legs, which show very limited regeneration. However, it has been shown that grafting of embryonic limb bud cells into the amputation sites of frogs can improve their regenerative ability. So, to achieve successful regeneration, one requirement is a mechanism to de-differentiate connective tissue cells into multipotent cells similar, or identical to, those of the embryonic limb bud.
But this is only half the story. To regenerate a complex structure like a limb, these cells need to re-differentiate into the various functional cell types arranged in a complex three-dimensional pattern. This is the role of positional information.
Positional information is a concept invented by Lewis Wolpert (1929–2021), a public intellectual well known both in developmental biology and in wider social circles. In the late 1960s, he proposed that developing or regenerating systems must have some kind of embedded information that varies with position, such that multipotent cells can look at the positional information in their locality and use it to decide into what cell type to differentiate. Wolpert postulated the existence of positional signals—for example, gradients of diffusible molecules, which set up the system; and positional values, which were a long-term stable representation of the positional information. This latter concept of positional value is particularly important in regeneration because the information is needed not just for embryonic development, but also to be available to control regeneration after maybe years of the animal’s life.
The identity of many positional signals was discovered between 1980 and 2000 through intensive studies of embryonic development in frogs, mice, fruit flies, and nematode worms. They are composed of small proteins secreted by cells, which are often called “growth factors” or “cytokines” in other contexts. They include molecules discovered by biochemists, like fibroblast growth factors, transforming growth factors, and bone morphogenetic proteins, and others discovered by geneticists with weird names like Wnt and Hedgehog. Most of these factors are active during limb development and again during regeneration. However, they do not persist during adult life. What does persist is the system of positional values, which were only discovered recently.
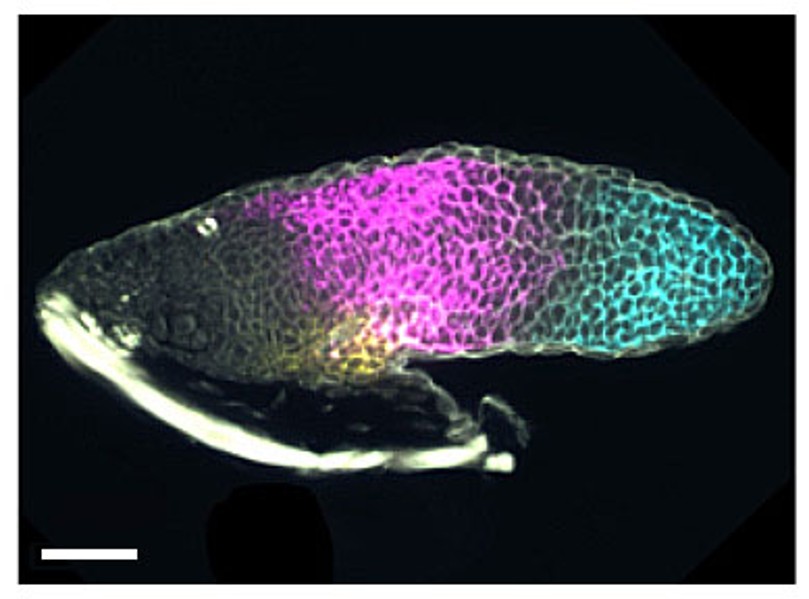
Fig.3. Visualisation of positional values in a larval limb bud. mRNA for shox is magenta, and for hoxa13 is cyan. Scale bar 100µm. From Fig.5 in T.J.Duerr et al. bioRxiv preprint doi: https://doi.org/10.1101/2024.08.07.607055.
The key elements of positional value are the genes that define specific body regions during embryonic development. Such genes all encode transcription factors, which are proteins that control the expression of other genes. For example, in the limb, expression of a gene called shox defines the middle part of the limb and of another gene called hox-a13 defines the hand or foot. These genes are not expressed in the mature limb, but they are still “open for business” in the appropriate regions. For example, hox-a13 is permanently repressed in the upper arm by a specific modification of chromosomal proteins, while in the hand it is not repressed and so it can be re-expressed when exposed to the stimuli of regeneration. In other examples, there is very low-level expression of the relevant positional information genes in the adult, which can be upregulated in regeneration. There are also some cell adhesion molecules, regulated by the same genes, that keep the cell populations in appropriate groups as regeneration proceeds.
Although mammals use the same genes to specify positional information in embryonic development, these genes cannot be reactivated in the adult. Mammals have neither the appropriate multipotent cells nor the appropriate positional information to enable successful regeneration. This is why “they can do it and we can’t.” Whether these key elements can be rebuilt using the modern techniques of regenerative medicine remains a question for the future.
The term “binomial expression” sounds very math-like, and it is. It refers to a mathematical expression with two terms connected by an operator. So 3a + b is a binomial, as is 2x3 + 6x. In algebra, binomials are used to solve equations, often by converting more complex polynomial expressions to a binomial. For example, x2 − 7x + 10 = 0 can be expressed as the binomial (x − 2)(x − 5) = 0, leading to the conclusion that either x = 5 or x = 2.
But enough math. Binomials also occur in language, and where they refer to expressions like chicken and egg, by and large, in and out, cut and dried, or peace and quiet. Often, and perhaps usually, such expressions occur in a fixed A and B order: we don’t hear egg and chicken, large and by, out and in, dried and cut, or quiet and peace. Those word orders should make your head hurt worse than the math did.
English has hundreds of such expressions, and the scholarly literature on them numbers dozens of articles. Modern interest in binomials goes back to the mid-twentieth-century work of linguists like Yakov Malkiel (in a 1959 article called “Studies in Irreversible Binomials”) and Dwight Bolinger (whose 1962 article, “Binomials and Pitch Accent,” looked at the metrical structure of binomials). Later work by William Cooper and John Robert Ross (in a 1975 paper called “Word Order”) proposed that the terms which occurred first tended to be those closer to a speaker’s experience (an idea they called the Me First Principle). They also stressed the relevance of phonological and semantic properties of words. Other scholars have proposed that word frequency plays a role, with more frequent words tending to be in the first position. For an excellent overview, consult Sarah Bunin Benor and Roger Levy’s 2006 article, “The Chicken or the Egg.”
Some fixed phrases may have idiosyncratic explanations: black and white, as in “it’s right there in black and white,” gets its order from the foregrounding of lettering on the backgrounded page. Come and go suggests a temporal precedence: you have to come before you can go, but what about stop and go?
In addition, many binomials can be reversed: beer and wine seems as likely as wine and beer, and peppers and onions as likely as onions and peppers. To me, left and right, on and off, and night and day seem fine in either order. But cheese and crackers does not work nearly as well as crackers and cheese, and a cheese and ham sandwich sounds downright odd. Tables and chairs seem natural if you are shopping for furniture, as in “We were looking at new tables and chairs” rather than “new chairs and tables.” But if you are writing a novel and describing a brawl, you might have a character step carefully among the overturned “chairs and tables.” And as Benor and Levy noted, even fixed binomials can be reversed, when necessary, as in the Billy Joel song “Piano Man,” with its barfly “making love to his tonic and gin.” The reversal of the libation completes the rhymes with “the regular crowd shuffles in.”
Reversal of a fixed binomial can also be a forensic tell. When the terrorist Theodore Kaczynski, aka the Unabomber, wrote his anti-technology manifesto in the 1990s, he used the outdated binomial expression “eat your cake and have it too” rather than the more common “have your cake and eat it too.” That idiosyncratic reversal was one of the clues that led to his identification and capture.
Although the concept of visual abstracts began even before the widespread use of the internet, with journals like Angewandte Chemie and Tetrahedron Lettersfeaturing graphical abstracts in the late 20th century, it wasn’t widely used across all journals until the surge in scholarly papers and information overload. Given that almost 3 million scientific papers were indexed by Scopus and Web of Science alone in 2022, it isn’t surprising that it takes 17 years for research evidence to reach clinical practice. Therefore, for research to influence clinical practice, it must be effectively communicated to key audiences such as policymakers, healthcare professionals, and patients.
Since 2016, Dr Andrew Ibrahim has helped popularize the use of visual abstracts on social media. His studies have shown that presenting research findings in a visual way promises to improve audience reach and drive change, as visual abstracts make use of our ability to rapidly process and retain visual over textual information.
Planning your visual abstract
Paediatrics & Child Healthencourages authors to submit visual or video abstracts with their manuscripts. While visual (or graphical) abstracts provide a succinct, pictorial summary of the paper, video abstracts are short, engaging audio-visual recordings. These abstracts give readers a quick, visual overview of an article’s main findings and information briefly. The purpose of visual abstract isn’t to divulge all the details of a study or to replace the full text, but to provide busy readers with an efficient way to find articles of interest. However, as the addition of visual abstracts on social media is relatively new (since 2016), there is a need for more quantitative studies to fully understand how effective visual abstracts are in communicating research. Preliminary data suggest that visual abstracts do increase text abstract views and enhance Altmetric attention scores of papers.
Follow these tips to create effective visual or video abstracts.
First, wrap up your paper: Develop your abstract after fully writing your manuscript. This will help you to fully understand your research story and highlight the key aspects of your paper. Ask yourself these questions:
Why did I decide to do this research?
What is the problem/knowledge gap my work addresses?
How do my key findings compare with what has been done previously?
And how does it matter to my peers and the public?
Create a plan: Plan out your ideas and organize your abstract in a logical way, so that readers can take a quick glance and easily follow. You can use SmartArt Graphics on Microsoft PowerPoint (process, cycle, list, matrix etc.) or search for similar elements on Canva.
Learn about your audience: It is important to understand your audience’s level of expertise when choosing the visual elements for your graphical abstract.
Less is more: Select key points from each section of your paper. This will keep your abstract succinct. Adding too many details can overwhelm the readers. The purpose of a visual or a video abstract isn’t to replace full-text articles but to pique the interest of the reader.
What to keep in mind: Learn what sizes and formats are allowed. For Paediatrics & Child Health, for example, graphical abstracts should be one panel, 1200 pixels (width) x 900 pixels (height) at 300 ppi (which corresponds to 4 inches/10 cm x 3 inches/7.5 cm at 300 ppi). You can submit your graphical abstract as TIFF, PDF or JPG file and video abstracts as AVI or MP4 files. Other journals or societies may have different requirements.
Get feedback before you submit: Send your visual or video abstracts to folks not only within your profession but also outside it, to see if they understand your paper just by looking at your visual or video abstract.
Technical tips for creating your visual abstract
There are technical elements to creating a visual abstract. Here are some tips for how to approach the process. For graphical abstracts:
Choose a design program you are comfortable with such as Microsoft PowerPoint, Adobe Creative Cloud, Canva, etc.
Select a colour palette (≤5 colours) and a font size (12- to 16-point UNICODE) to ensure legibility.
Use simple and clear visual elements/icons to communicate your research. For general graphical elements, you can use PowerPoint, Canva, Draw.io, and Adobe Illustrator. However, for more specific visual elements, you can use software such as:
BioRender for creating professional, scientific figures. It is best for life sciences, medicine, and biology papers.
Mind the Graph for creating compelling infographics from scratch. This tool is best for health professionals, scientists, and academicians.
ChemDraw to draw out chemical reactions or biomolecules e.g., drawing out the structures of essential amino acid or adenosine diphosphate in your manuscript.
If pictograms/images won’t help communicate your research work, you can always include data or charts. For information on different chart types and their uses, try The Data Visualisation Catalogue.
Once you have created your graphical abstract, proofread and revise if necessary.
If a video abstract best suits your paper:
It is good practice to begin your video with a hook to catch the attention of your viewers. Start the video with an interesting question or revealing key findings of your study.
To make your video, create a storyboard to identify potential issues using free software like Canva storyboards or Wonder Unit Storyboarder.
Select your mode of delivery:
Talking head: You can record yourself talking about your study, creating a human connection between you and your audience.
Presentation style: If you are looking for a free, beginner-friendly way to record your video abstract, you can create simple visuals on Microsoft PowerPoint or Canva and record the presentation.
Whiteboard animation: You can make a video abstract by drawing out the key findings of your paper on an actual whiteboard (or using a whiteboard tool online). This method is effective but might need some prior sketching practice. To make it more creative and add motion to your drawing, you can create animated videos using Canva, Powtoon, Microsoft PowerPoint or other paid software.
Record your audio-visual: If you opt to create a talking head video, you can use a mobile phone or a digital camera using the highest quality to record your video. For recording the script, select a quiet room and, if possible, use a plug-in microphone. Ensure your voice is audible and clear, and your tone resonates with your intended audience. You can also add free music to your video (check license and copyrights).
End your video with a call to action e.g., you can say something like “now that you’ve watched this video, don’t forget to read and share this paper” to the audience to increase the chances of a viewer taking action.
Lastly, use any editing software (e.g., Canva Pro, PowerPoint, iMovie, descript) to put together your final video abstract.
Conclusion
Visual and video abstracts are effective ways to increase visibility, reach, and engagement of your research work. For example, the papers published in Paediatrics & Child Health accompanied by visual abstracts, some of which were recently shared on the journal’s LinkedIn page, received higher engagement and article views on both platforms.
For more information about submitting your manuscript to Paediatrics & Child Health, please visit our website or email us at journal@cps.ca.